Retail performance Dashboard
In our pursuit of becoming the market leader in the on-demand moving and delivery industry, we identified key objectives to drive our success.
- Objective #1: Be the market leader in the on-demand moving and delivery industry.
- Key Result (KR) #2: Increase retail sales.
- Objective #3: Serve more customers with less effort.
- Key Result (KR) #3: Lower support-time per Dolly.
Reflecting on our journey, Dolly initially concentrated efforts on high-revenue MVPs like Ikea and Costco, making exceptions to secure partnerships (Costco On Demand, Ikea) or adopting less sustainable, manual approaches (AB187, geofences). As we grew and took on more partnerships, the need for a scalable, long-term strategy became apparent. Focusing on a solid product for broader retailers became crucial.
However, before setting sustainable goals for the future, it was essential to assess our current standing. This prompted me to delve into an exploration phase, seeking a comprehensive understanding of our present situation as a foundation for our strategic objectives.
I worked to create a Retail Performance Dashboard Using metabase. Utilizing MySQL and my knowledge of the tool to create data visualizations to tell the story of our current state.
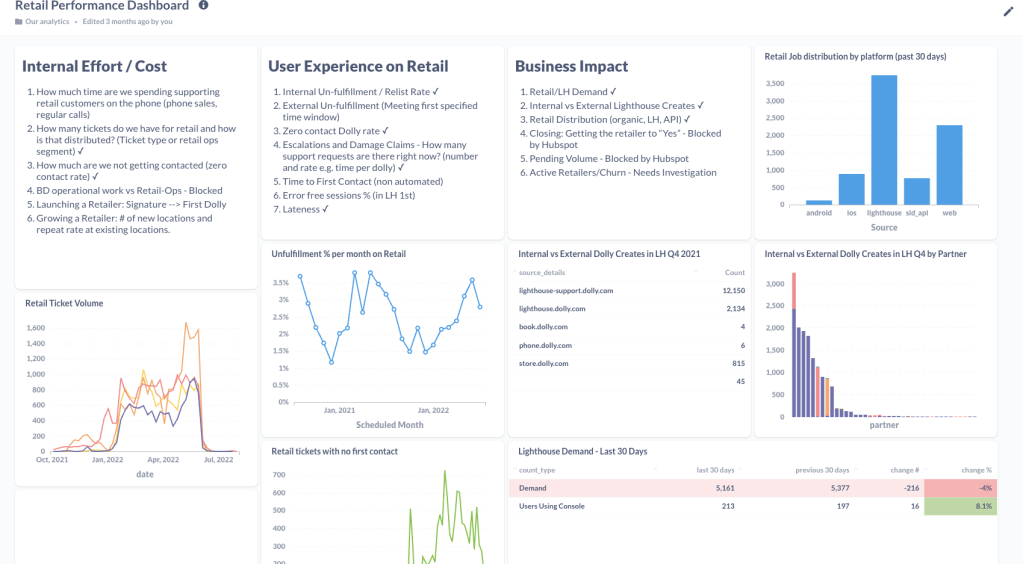
Retail performance dashboard
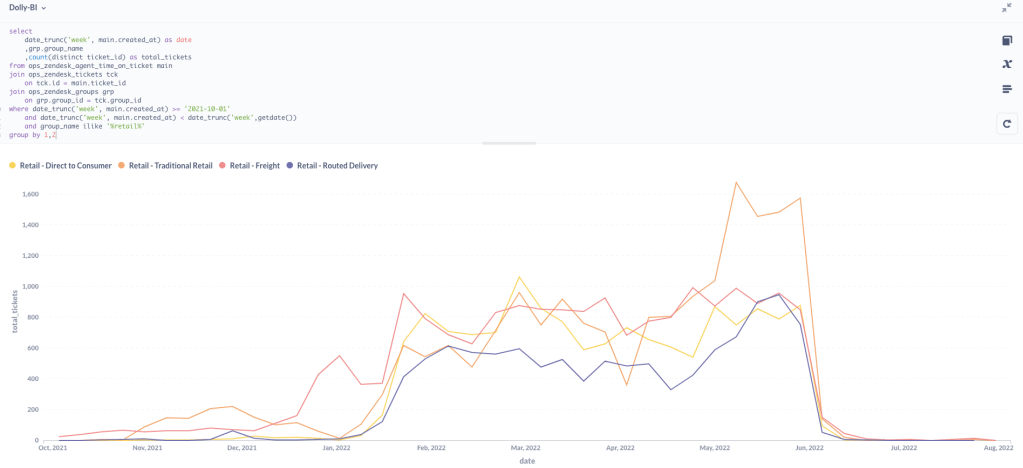
SQL Query to determine how many inbound retail support tickets by segment
Lighthouse Error reporting and Audit
Facing challenges with Lighthouse and its management tools, usability suffered due to their unreliability and lack of understanding. Additionally, the absence of defined SLAs hindered the ability to establish benchmarks for measurement. The problems stemmed from various areas:
- Difficulty logging into Lighthouse.
- Internet and connection issues within Lighthouse.
- Unhelpful user errors experienced in Lighthouse.
- Complicated configurations in Business/Site Manager leading to operational issues.
This presented a narrative where the reliability and understanding of Lighthouse were at the core of usability issues, with multiple facets contributing to the overall problem.
Using Amplitude, I begin to draw up an error audit log to better delve into the issues and identify core problems so that we could work on the right solutions.

Lighthouse error reporting dashboard
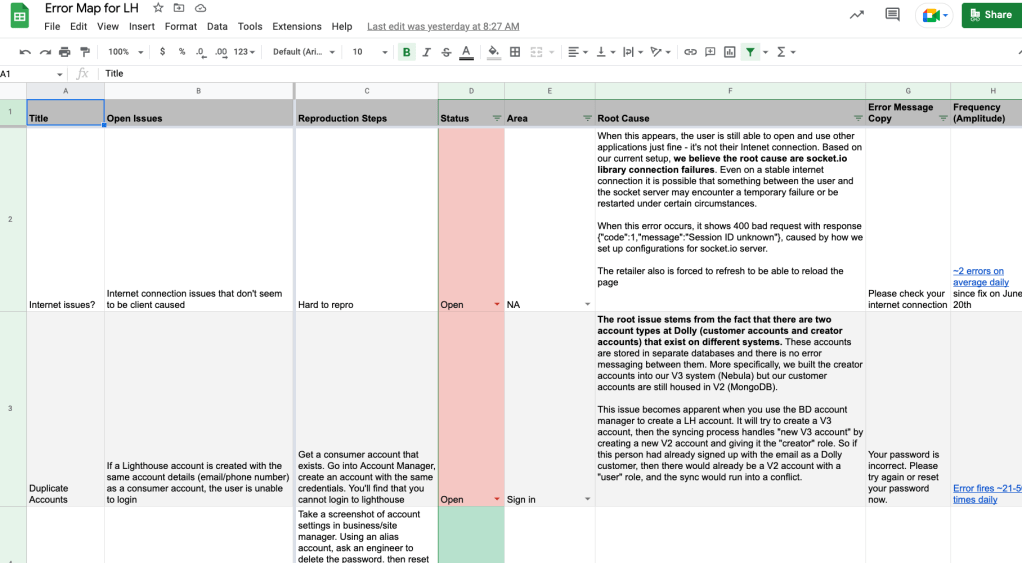
Error working audit log with RCA, frequency, severity and context

Leave a comment